
B2B Infographic Design
B2B infographic design turns dense information into visual communication that helps buyers, stakeholders and internal teams quickly understand what matters. When technical concepts, research or data are difficult to explain, well-designed infographics make your message easier to absorb, remember and act on.

Turn information overload into understanding
B2B marketers are often asked to explain complex information, technical processes, market research and performance data to audiences with different levels of expertise. Internal teams understand the details. External audiences do not. Leadership needs executive summaries. Sales teams need simple visuals to use in conversations.
Without a structured approach to information design, dense content becomes difficult to navigate. Reports go unread. Presentations become text-heavy. Sales conversations slow down.
When information isn’t easy to understand, decision-making slows, alignment breaks down and valuable insights lose their impact.
This is the kind of friction we’re built to fix.
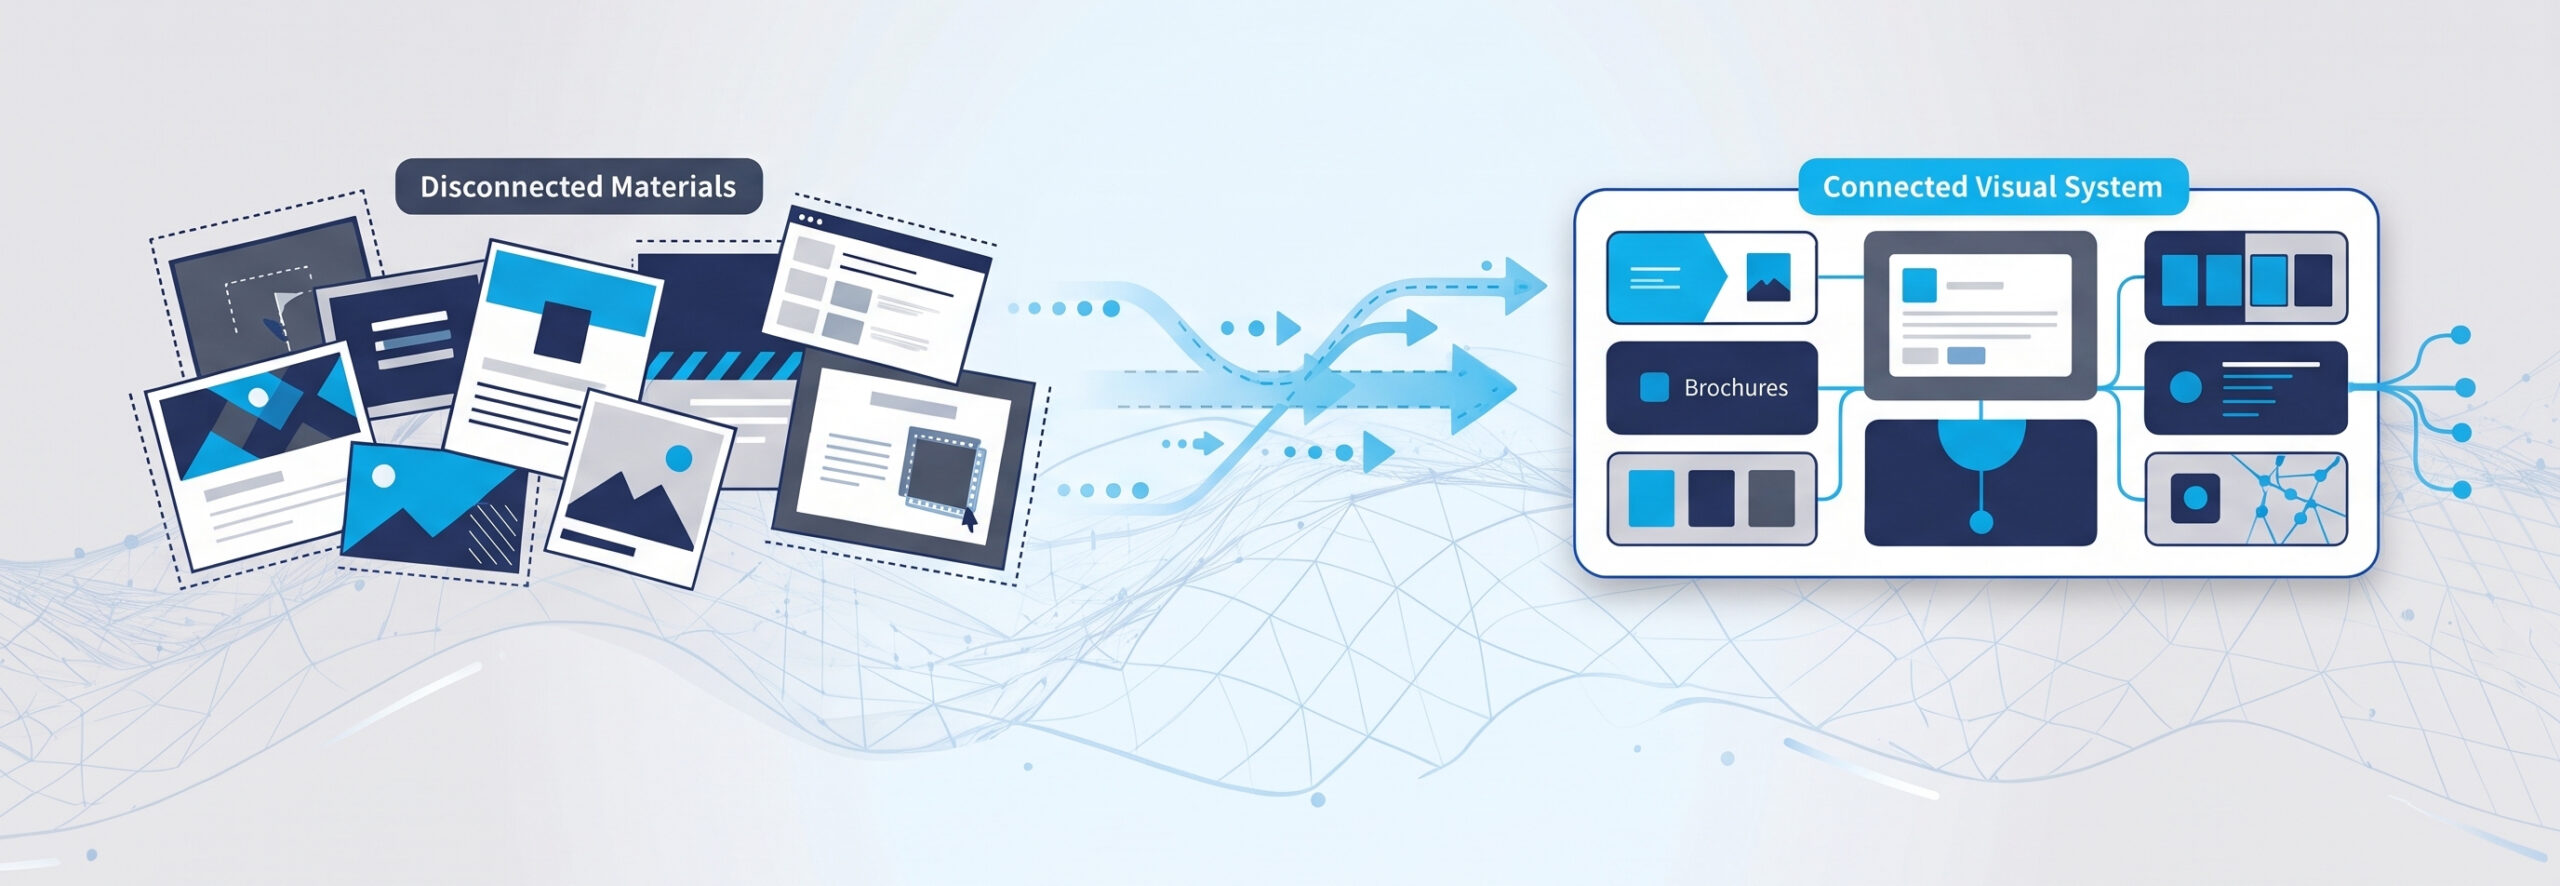
What strong information design makes possible
Good infographic design does more than organize content. It helps people process information faster and make better decisions.
With thoughtful visual communication, you can:
- Turn technical or data-heavy content into visuals that are easier to understand
- Reduce time spent explaining the same concepts across sales, marketing and executive teams
- Improve consistency across materials
- Help audiences quickly grasp information
- Create reusable visual assets to support product launches and internal communication
- Present research, metrics and processes in ways people are more likely to remember
From dense information to visual understanding
Information strategy
Every infographic begins by identifying the message that matters most and organizing information around what your audience needs to understand.
- Content hierarchy
- Message architecture
- Audience planning
Data visualization
We transform reports, research and metrics into visuals that reveal patterns, relationships and key takeaways instead of overwhelming readers with numbers.
- Charts and graphs
- Data storytelling
- KPI visualization
Technical communication
Complex products, workflows and processes become easier to follow through structured visual systems designed for business audiences.
- Process diagrams
- System illustrations
- Technical infographics

Multi-channel adaptation
Infographics are designed to work wherever your audience encounters them, from sales presentations to thought leadership reports, videos and digital experiences.
- Presentations
- Sales collateral
- Videos
- Social media graphics
- Interactive experiences
What changes once your visuals do the work
The value of infographic design isn’t measured by how polished it looks. It’s measured by how effectively people understand, retain and act on information.
Once the system is in place, teams typically see:
 2,000+ projects delivered annually
 4.9/5.0 client satisfaction score*
Trusted by global brands including Visa and Cigna

















Make your expertise easier to understand
Your audience shouldn’t have to work to understand your content. The right visual system helps ideas move faster, conversations more productive and turns information into momentum instead of confusion.
FAQs
How do you approach B2B infographic design?
We begin by understanding your audience, business goals and the decisions the infographic needs to support. From there, we organize the information into a logical narrative before designing visuals that reinforce understanding instead of simply decorating the content. The priority is always usability — removing friction between the information and the person who needs to act on it.
How can a creative agency support B2B infographic design?
A creative agency helps transform technical information, research and business data into visual assets that are easier for clients, stakeholders and employees to understand. Beyond design, the process includes organizing information, prioritizing key messages and creating memorable visuals that fit naturally into presentations, sales materials, thought leadership and marketing initiatives.
What should you look for in a professional infographic designer?
Look for a creative agency or designer with experience translating technical B2B information rather than simply producing attractive graphics. Strong infographic design requires information architecture, visual communication skills and an understanding of how business audiences consume information.
How do you choose the right infographic designer?
Choose an infographic designer by looking for relevant experience, a clear process and work that makes complex information easier to understand. Review examples that demonstrate data visualization, technical communication and B2B storytelling, then confirm the designer can work with your audience, source materials and intended use.
What’s a typical infographic turnaround time?
Timelines depend on the scope of the project, the complexity of the content and the availability of source materials. A straightforward infographic may move quickly, while projects involving research, multiple stakeholders or extensive data visualization typically require additional planning and review.
Does infographic design help with lead generation efforts?
Yes. Infographics can support lead generation by making educational content more engaging and easier to share. They are often used within thought leadership, downloadable resources, sales enablement materials and campaign assets to help audiences understand complex topics more quickly.
What industries benefit from infographic design services?
Any B2B organization that communicates technical, regulated or information-heavy topics can benefit from infographic design. We frequently support organizations in healthcare, technology, financial services, manufacturing and other industries where simplifying dense information helps buyers and stakeholders make more informed decisions.
*Survey conducted by independent consultant